
IPEDS 150% Graduation Rate
VGCC vs Comparison Group (IPEDS 150% Graduation Rate by Race)
Cohort Year: 2013 – 2019
Black/African American

| Fall Term Cohort | Comparison | VGCC |
|---|---|---|
| 2013 | 13% | 31% |
| 2014 | 15% | 29% |
| 2015 | 10% | 24% |
| 2016 | 13% | 26% |
| 2017 | 17% | 32% |
| 2018 | 17% | 17% |
| 2019 | 23% | 16% |
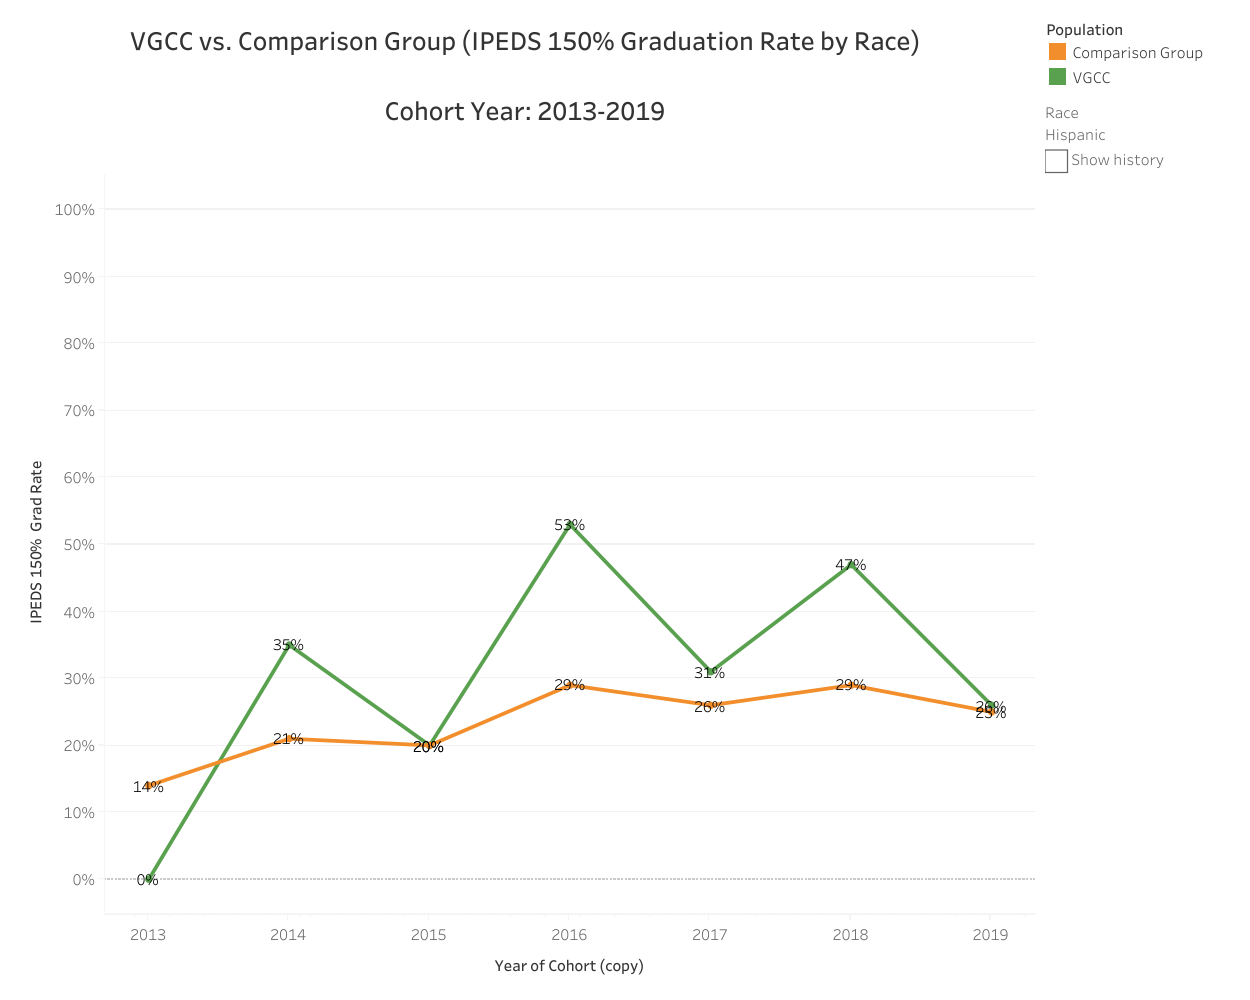
Hispanic
| Fall Term Cohort | Comparison | VGCC |
|---|---|---|
| 2013 | 14% | 0% |
| 2014 | 21% | 35% |
| 2015 | 20% | 20% |
| 2016 | 29% | 53% |
| 2017 | 26% | 31% |
| 2018 | 29% | 0% |
| 2019 | 25% | 26% |
White

| Fall Term Cohort | Comparison | VGCC |
|---|---|---|
| 2013 | 28% | 35% |
| 2014 | 28% | 34% |
| 2015 | 27% | 51% |
| 2016 | 32% | 39% |
| 2017 | 35% | 46% |
| 2018 | 40% | 39% |
| 2019 | 38% | 43% |
Asian

| Fall Term Cohort | Comparison | VGCC |
|---|---|---|
| 2013 | 20% | 100% |
| 2014 | 29% | 75% |
| 2015 | 25% | 0% |
| 2016 | 33% | 0% |
| 2017 | 33% | 0% |
| 2018 | 43% | 0% |
| 2019 | 40% | 100% |
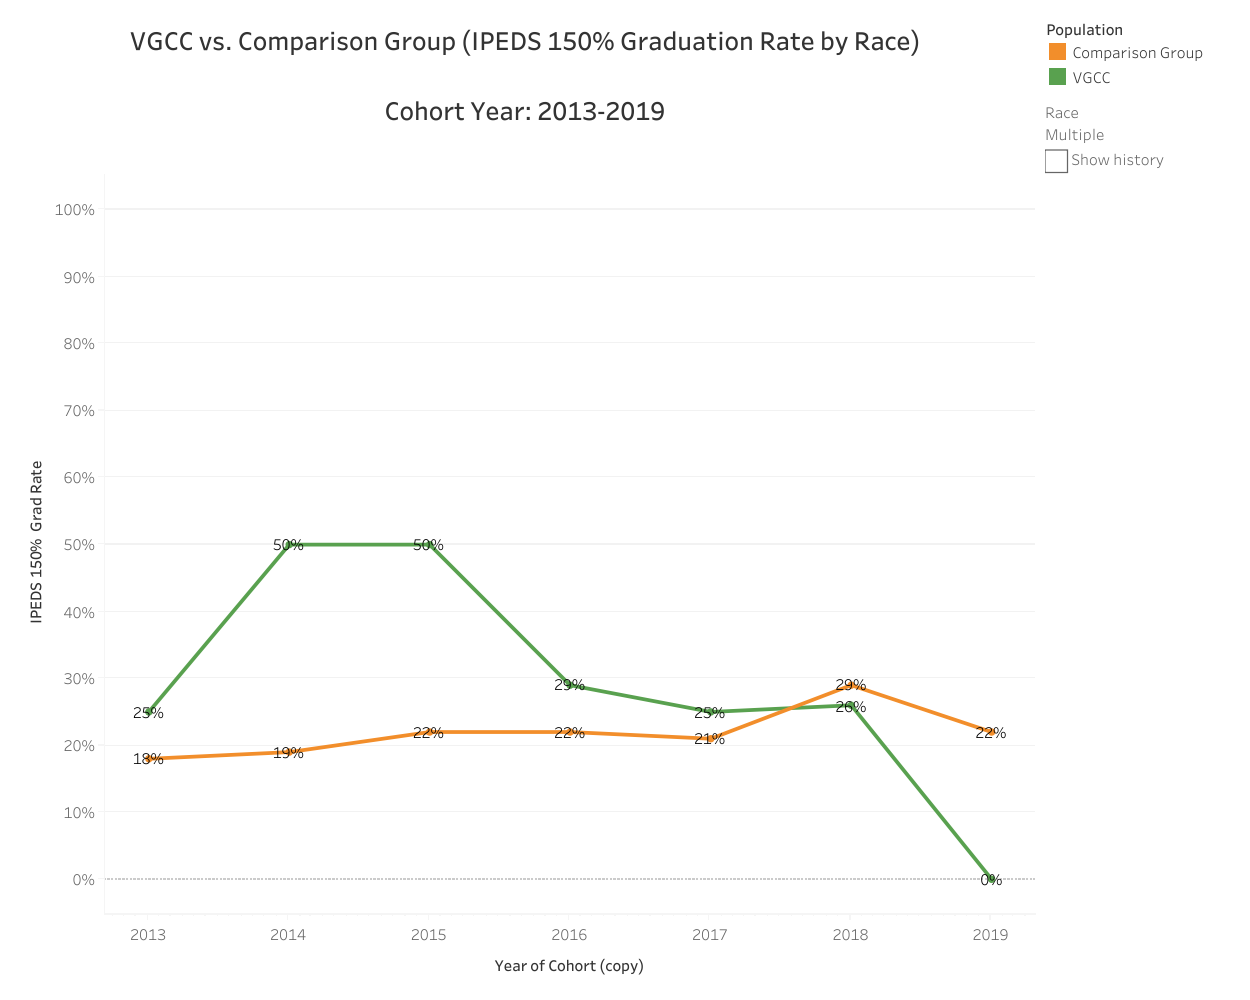
Multiple
| Fall Term Cohort | Comparison | VGCC |
|---|---|---|
| 2013 | 18% | 25% |
| 2014 | 19% | 50% |
| 2015 | 22% | 50% |
| 2016 | 22% | 29% |
| 2017 | 21% | 25% |
| 2018 | 29% | 26% |
| 2019 | 22% | 0% |
Native Hawaiian/Pacific Islander

| Fall Term Cohort | Comparison | VGCC |
|---|---|---|
| 2013 | 0% | 0% |
| 2014 | 0% | 0% |
| 2015 | 0% | 0% |
| 2016 | 0% | 0% |
| 2017 | 0% | 0% |
| 2018 | 7% | 0% |
| 2019 | 0% | 100% |
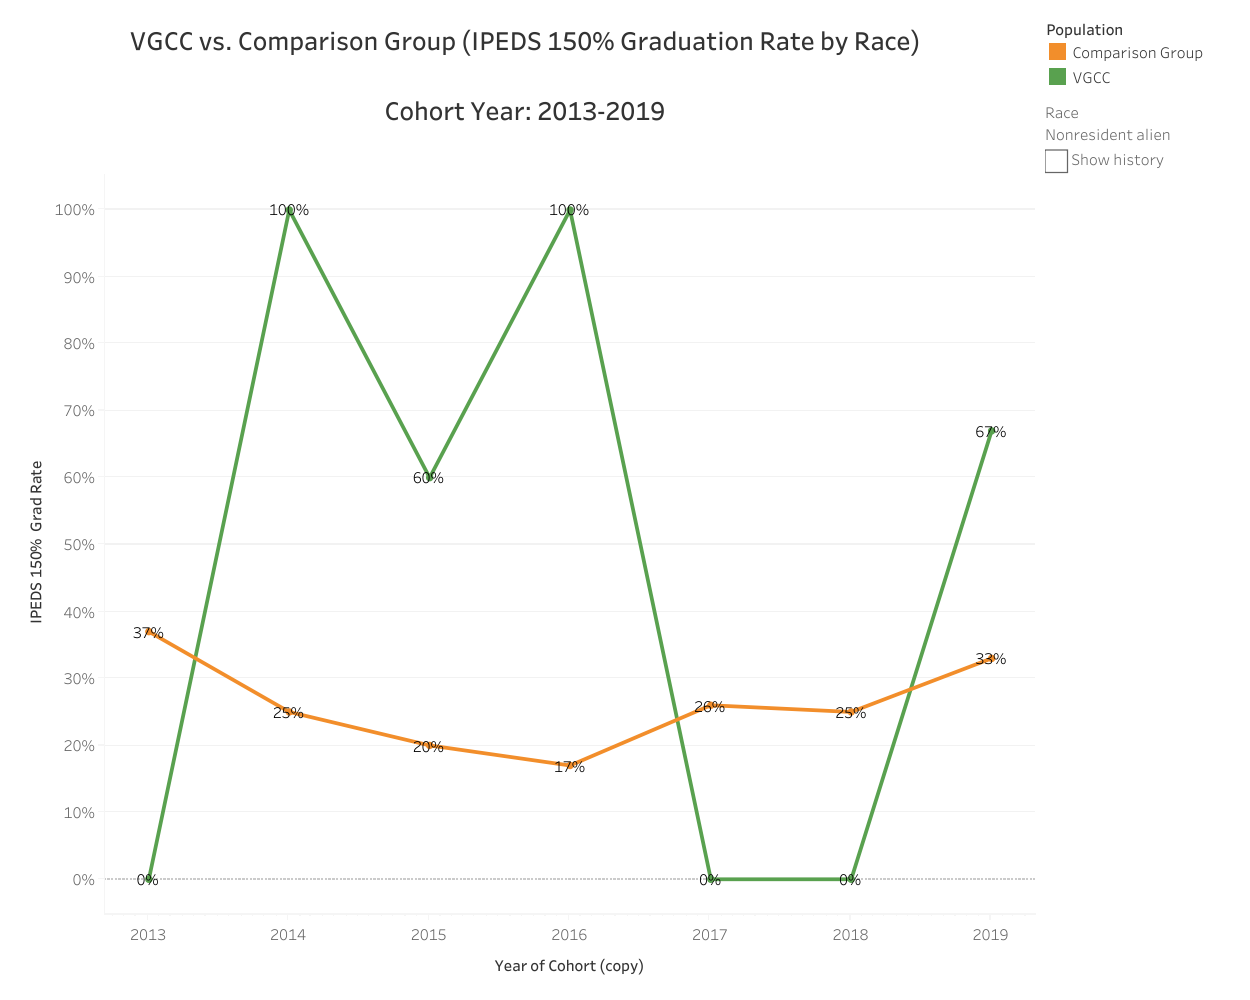
Nonresident Alien
| Fall Term Cohort | Comparison | VGCC |
|---|---|---|
| 2013 | 37% | 0% |
| 2014 | 25% | 100% |
| 2015 | 20% | 60% |
| 2016 | 17% | 100% |
| 2017 | 26% | 0% |
| 2018 | 25% | 0% |
| 2019 | 33% | 67% |
Unknown

| Fall Term Cohort | Comparison | VGCC |
|---|---|---|
| 2013 | 22% | 75% |
| 2014 | 20% | 33% |
| 2015 | 24% | 33% |
| 2016 | 32% | 100% |
| 2017 | 25% | 46% |
| 2018 | 33% | 0% |
| 2019 | 30% | 27% |